
Email Marketing Statistics
What are the email marketing statistics, email engagement rates for small to medium businesses?
Email Marketing rates can vary widely depending on factors such as industry, audience demographics, email content, and the effectiveness of your email marketing strategies. However, here are some general benchmarks for email engagement rates that small to medium businesses (SMBs) may aim for:
1. Open Rate: The percentage of recipients who open your email.
– Average open rates for SMBs typically range from 15% to 25%.
– High-performing campaigns may achieve open rates above 25%, while lower-performing ones may fall below 15%.
2. Click-Through Rate (CTR): The percentage of recipients who click on a link or call-to-action (CTA) within your email.
– Average click-through rates for SMBs typically range from 2% to 5%.
– Exceptional campaigns may achieve click-through rates above 5%, while lower-performing ones may fall below 2%.
3. Conversion Rate: The percentage of recipients who complete a desired action, such as making a purchase or filling out a form, after clicking on a link or CTA in your email.
– Average conversion rates for SMBs can vary widely depending on the specific goals of the email campaign (e.g., sales conversions, lead generation).
– Conversion rates may range from 1% to 10% or more, depending on factors such as the quality of your email content, the relevance of your offer, and the effectiveness of your landing page.
4. Bounce Rate: The percentage of emails that are undeliverable due to invalid email addresses or other delivery issues.
– A bounce rate of less than 2% is generally considered acceptable for most email campaigns. Higher bounce rates may indicate issues with your email list quality or delivery practices.
5. Unsubscribe Rate: The percentage of recipients who unsubscribe from your email list after receiving your email.
– Average unsubscribe rates for SMBs typically range from 0.1% to 0.5% per email sent.
– Lower unsubscribe rates indicate that your email content and frequency are resonating well with your audience, while higher unsubscribe rates may suggest that adjustments are needed.
It’s important to note that these benchmarks are just general guidelines, and actual email engagement rates can vary significantly based on your specific industry, audience segments, and campaign objectives. Additionally, regular testing, optimization, and audience segmentation are key strategies for improving email engagement rates over time.
Contact Contact Email Marketing statistics
The most recent report of email marketing statistics from the 28th Dec 2017 is the Constant Contact Average Email open and clickthrough rates by industry
Each email marketing tool has its own specific data. They vary between themselves. Look at the Mailchimp data – quite huge differences between industries.
| Business Type | Open Rate (Total) | Mobile Open Rate | Tablet Open Rate | Desktop Open Rate | Click-Through Rate | Bounce Rate | Unsubscribe Rate |
| Accommodations (ex. hotel, inn, B&B, camp grounds) | 16.88% | 64.18% | 19.64% | 44.15% | 6.17% | 9.08% | 0.02% |
| Accountant | 13.14% | 59.11% | 16.55% | 73.24% | 8.56% | 9.13% | 0.01% |
| Animal Services | 15.95% | 64.24% | 16.90% | 42.90% | 7.41% | 6.03% | 0.02% |
| Art, Culture, Entertainment (ex. galleries, museums, musicians, theatre, film, crafts) | 16.21% | 54.76% | 17.05% | 45.53% | 6.41% | 7.26% | 0.01% |
| Automotive Services | 13.56% | 64.65% | 14.14% | 42.87% | 8.08% | 8.48% | 0.03% |
| Child Care Services | 18.68% | 84.52% | 7.57% | 35.41% | 5.79% | 7.96% | 0.01% |
| Civic/Social Membership (ex. associations, chambers, clubs) | 23.23% | 60.48% | 14.17% | 71.97% | 7.91% | 9.48% | 0.01% |
| Consultant, Training (ex. marketing, management) | 13.93% | 53.18% | 9.47% | 69.89% | 7.19% | 11.58% | 0.01% |
| Education – Primary/Secondary (ex. elementary, middle, and high schools) | 23.05% | 69.21% | 10.64% | 49.95% | 7.83% | 8.48% | 0.01% |
| Education – Higher Education (ex. colleges, universities, trade schools) | 18.35% | 63.57% | 10.85% | 48.74% | 7.72% | 8.56% | 0.01% |
| Financial Advisor | 17.08% | 57.86% | 14.01% | 59.48% | 7.11% | 11.41% | 0.02% |
| Fitness Center, Sports, Recreation (ex. yoga studio, bowling alley, gym) | 15.72% | 67.84% | 13.79% | 35.25% | 5.60% | 10.03% | 0.01% |
| Fitness/Nutritional Services (ex. personal trainer, wellness coach) | 14.20% | 71.66% | 11.96% | 33.94% | 6.86% | 6.93% | 0.02% |
| Government Agency or Services | 22.51% | 65.58% | 14.22% | 73.59% | 9.14% | 10.05% | 0.01% |
| Health & Social Services (ex. hospital, elder care, adoption services) | 19.18% | 59.02% | 14.53% | 71.26% | 6.69% | 10.20% | 0.02% |
| Health Professional (ex. physician, dentist, chiropractor) | 16.94% | 63.14% | 14.47% | 51.29% | 6.23% | 10.18% | 0.03% |
| Home & Building Services (ex. construction, HVAC, landscaping, design) | 19.66% | 56.00% | 15.36% | 59.84% | 5.72% | 10.87% | 0.04% |
| Insurance | 15.10% | 52.55% | 9.15% | 84.43% | 6.86% | 7.63% | 0.02% |
| Legal Services | 20.61% | 57.42% | 9.19% | 71.66% | 6.80% | 12.42% | 0.02% |
| Manufacturing and Distribution | 14.87% | 47.65% | 11.57% | 71.21% | 7.85% | 11.90% | 0.01% |
| Marketing, Advertising, Public Relations | 10.36% | 51.25% | 10.38% | 51.34% | 5.98% | 9.17% | 0.01% |
| Other | 22.50% | 53.79% | 15.42% | 45.24% | 4.69% | 8.61% | 0.01% |
| Other – Non-profit | 19.71% | 59.52% | 15.76% | 57.46% | 6.86% | 9.68% | 0.02% |
| Personal Services (ex. dry cleaning, photography, housekeeping) | 17.62% | 59.78% | 13.85% | 48.66% | 6.30% | 9.59% | 0.02% |
| Professional Services | 17.40% | 57.61% | 12.02% | 63.66% | 7.39% | 10.72% | 0.02% |
| Publishing | 14.87% | 54.17% | 15.80% | 52.80% | 12.84% | 8.99% | 0.01% |
| Real Estate | 15.99% | 54.14% | 9.80% | 55.80% | 6.32% | 11.89% | 0.02% |
| Religious Organization | 25.62% | 71.11% | 20.36% | 47.80% | 6.69% | 7.98% | 0.01% |
| Restaurant, Bar, Cafe, Caterer | 15.66% | 59.11% | 17.30% | 39.16% | 4.22% | 10.22% | 0.02% |
| Retail (ex. brick and mortar and online) | 11.51% | 56.23% | 19.62% | 34.36% | 6.70% | 6.76% | 0.01% |
| Salon, Spa, Barber (ex. nails, tanning) | 13.42% | 66.08% | 13.81% | 28.13% | 3.69% | 13.50% | 0.01% |
| Technology (ex. web developer) | 13.03% | 43.83% | 6.82% | 75.20% | 5.85% | 11.56% | 0.01% |
| Transportation | 17.80% | 64.67% | 13.46% | 63.32% | 14.56% | 10.47% | 0.02% |
| Travel and Tourism (ex. limo driver, tour guide, reservations) | 14.67% | 50.50% | 19.87% | 53.36% | 6.69% | 11.22% | 0.02% |
| Unknown | 12.66% | 60.79% | 14.68% | 49.64% | 7.96% | 9.82% | 0.01% |
Mailchimp Email Marketing Statistics
Mailchimp has monthly updates of their Email benchmark stats which give a great source of comparing email response by industry. This Email marketing statistics were last updated on 1st February 2017 (there are available December 2023 email engagement rates).
Constant Constant and Mailchimp send billions of emails a month for more than 10 million users. This is probably the largest global sample of email marketing statistics that has been created.
What is the breakdown of market share for email clients on mobile and desktop?
Litmus, one of the best sources for Email Marketing Statistics 2017 regularly produce a summary of the email experience of different users – this is their start of 2018 round-up of the previous year.
This chart summarizing their research shows the rise of mobile email marketing to the point that nearly half of emails are opened on smartphones and tablets.
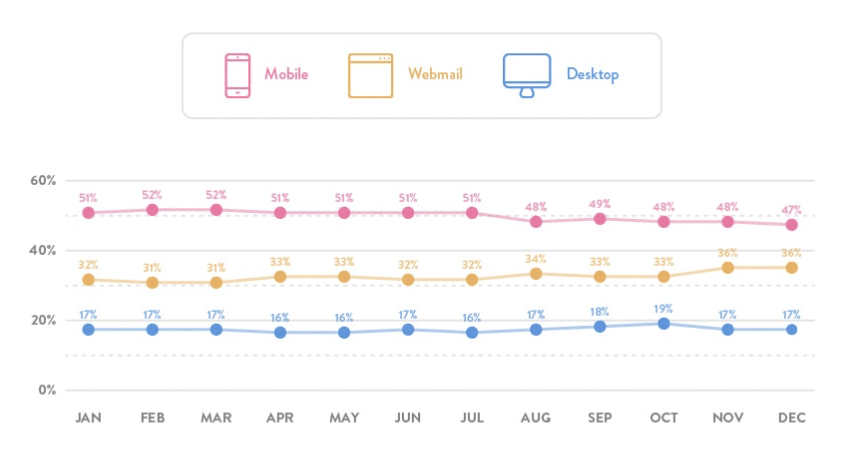
The top 10 most popular email clients as of December 2017 (Ranking compared to December 2016)
iPhone, 28% (+/- 0)
Gmail, 26% (+/- 0)
iPad, 11% (+/- 0)
Apple Mail, 7% (+ 1)
Outlook, 6% (+1)
Samsung Mail, 5% (NEW)
Outlook.com, 4% (+/- 0)
Google Android, 3% (- 4)
Yahoo! Mail, 2% (-1)
Windows Live Mail, 1% (+/- 0)
iPhone, Gmail, and iPad remained the top 3 email clients in 2017.
Only two percentage points separate Gmail from the most popular email client, Apple’s iPhone.
Combining Samsung Mail and other Android clients opens on Android account for 8% of market share or #4 in our top ten list.

 https://www.digideo.co/wp-content/uploads/2024/07/Zoho-Checkout-home.png
817
1520
admin
https://www.digideo.co/wp-content/uploads/2023/06/digideo2019-340-1.jpg
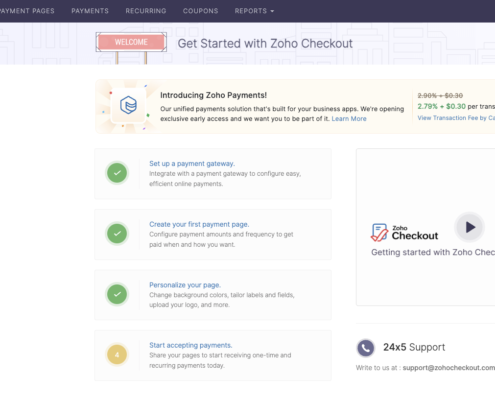
admin2024-07-22 13:38:072024-07-22 13:48:46Streamline Your Payment Processes with Zoho Checkout: A Comprehensive Review
https://www.digideo.co/wp-content/uploads/2024/07/Zoho-Checkout-home.png
817
1520
admin
https://www.digideo.co/wp-content/uploads/2023/06/digideo2019-340-1.jpg
admin2024-07-22 13:38:072024-07-22 13:48:46Streamline Your Payment Processes with Zoho Checkout: A Comprehensive Review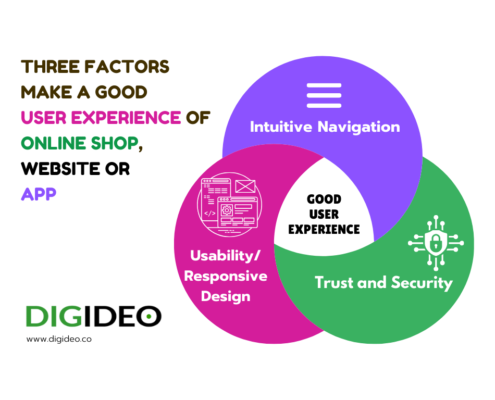 Digideo
https://www.digideo.co/wp-content/uploads/2024/07/2.png
768
1024
admin
https://www.digideo.co/wp-content/uploads/2023/06/digideo2019-340-1.jpg
admin2024-07-17 15:25:422024-07-22 12:59:22What factors contribute to a good user experience in an online shop
Digideo
https://www.digideo.co/wp-content/uploads/2024/07/2.png
768
1024
admin
https://www.digideo.co/wp-content/uploads/2023/06/digideo2019-340-1.jpg
admin2024-07-17 15:25:422024-07-22 12:59:22What factors contribute to a good user experience in an online shop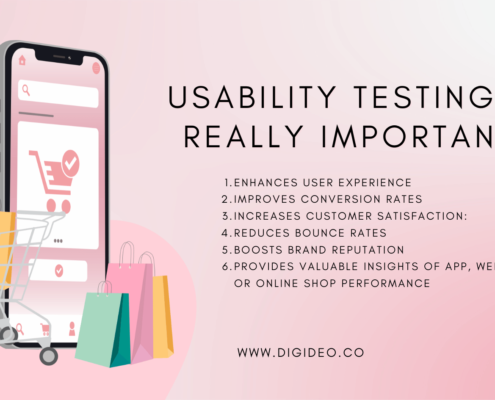 Digideo
https://www.digideo.co/wp-content/uploads/2024/07/Usability-testing-is-really-important.png
945
1680
admin
https://www.digideo.co/wp-content/uploads/2023/06/digideo2019-340-1.jpg
admin2024-07-07 12:02:482024-07-17 16:19:42Usability Testing is important
Digideo
https://www.digideo.co/wp-content/uploads/2024/07/Usability-testing-is-really-important.png
945
1680
admin
https://www.digideo.co/wp-content/uploads/2023/06/digideo2019-340-1.jpg
admin2024-07-07 12:02:482024-07-17 16:19:42Usability Testing is important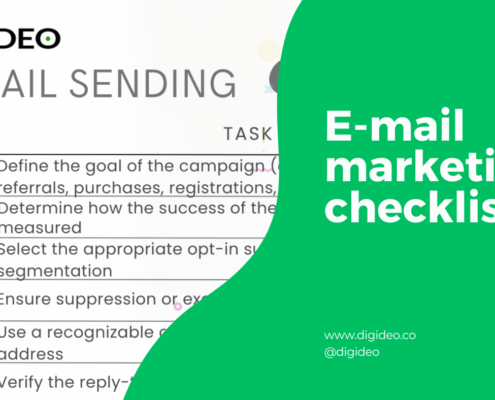 Digideo
https://www.digideo.co/wp-content/uploads/2024/06/E-mail-marketing-checklist-banner-new.png
788
1400
admin
https://www.digideo.co/wp-content/uploads/2023/06/digideo2019-340-1.jpg
admin2024-06-08 20:08:522024-07-18 16:43:57Email marketing checklist
Digideo
https://www.digideo.co/wp-content/uploads/2024/06/E-mail-marketing-checklist-banner-new.png
788
1400
admin
https://www.digideo.co/wp-content/uploads/2023/06/digideo2019-340-1.jpg
admin2024-06-08 20:08:522024-07-18 16:43:57Email marketing checklist Digideo
https://www.digideo.co/wp-content/uploads/2024/05/future-trends-in-crm-automation.png
1400
1400
admin
https://www.digideo.co/wp-content/uploads/2023/06/digideo2019-340-1.jpg
admin2024-05-30 14:01:132024-05-31 14:14:52Future Trends in CRM Automation – AI
Digideo
https://www.digideo.co/wp-content/uploads/2024/05/future-trends-in-crm-automation.png
1400
1400
admin
https://www.digideo.co/wp-content/uploads/2023/06/digideo2019-340-1.jpg
admin2024-05-30 14:01:132024-05-31 14:14:52Future Trends in CRM Automation – AI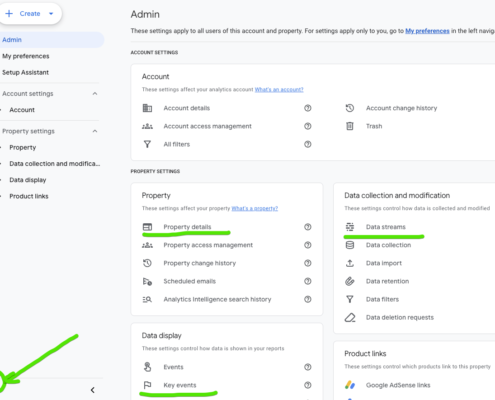 https://www.digideo.co/wp-content/uploads/2016/04/Google-Analytics-4-setup.png
885
1257
admin
https://www.digideo.co/wp-content/uploads/2023/06/digideo2019-340-1.jpg
admin2024-04-22 16:16:502024-07-22 09:00:36Google Analytics 4 multi-site tracking setup
https://www.digideo.co/wp-content/uploads/2016/04/Google-Analytics-4-setup.png
885
1257
admin
https://www.digideo.co/wp-content/uploads/2023/06/digideo2019-340-1.jpg
admin2024-04-22 16:16:502024-07-22 09:00:36Google Analytics 4 multi-site tracking setup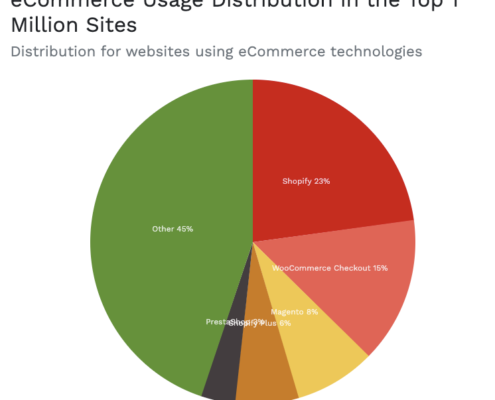 https://www.digideo.co/wp-content/uploads/2024/04/2024-eCommerce-technologies-Web-Usage-Distribution-🔊-2024-04-04-14-37-02.png
664
746
admin
https://www.digideo.co/wp-content/uploads/2023/06/digideo2019-340-1.jpg
admin2024-04-04 13:23:222024-05-31 14:24:25Ecommerce Statistics in 2024
https://www.digideo.co/wp-content/uploads/2024/04/2024-eCommerce-technologies-Web-Usage-Distribution-🔊-2024-04-04-14-37-02.png
664
746
admin
https://www.digideo.co/wp-content/uploads/2023/06/digideo2019-340-1.jpg
admin2024-04-04 13:23:222024-05-31 14:24:25Ecommerce Statistics in 2024 https://www.digideo.co/wp-content/uploads/2024/01/your-ecommerce-optimization-checklist.png
1080
1080
admin
https://www.digideo.co/wp-content/uploads/2023/06/digideo2019-340-1.jpg
admin2024-01-12 12:43:332024-06-17 12:46:59Your eCommerce optimization checklist
https://www.digideo.co/wp-content/uploads/2024/01/your-ecommerce-optimization-checklist.png
1080
1080
admin
https://www.digideo.co/wp-content/uploads/2023/06/digideo2019-340-1.jpg
admin2024-01-12 12:43:332024-06-17 12:46:59Your eCommerce optimization checklist
Share this entry